Aerospace Predictive Maintenance
A platform that predicts how much life is left in an aircraft engine from its sensor data. A stacked LSTM with attention reads the telemetry and estimates the flight cycles remaining, so maintenance can be scheduled on real wear instead of a fixed calendar.
Read the wear, not the calendar.
A stacked LSTM with attention reads a rolling 30-cycle window of engine sensor data and estimates how many flight cycles are left. Because it weights what it reads, every estimate arrives with the sensors that drove it.
The gauge runs down through an engine's life to the model's own output for a unit 12 cycles from failure. The bands are the operator's thresholds: above 200 cycles is healthy, 100 to 200 is watch, under 100 is act. The eight sensors that drove this particular call are further down, under explainability.
The most expensive event in aviation.
Engine failure is the maintenance event airlines fear most. Time-based schedules ignore how worn an engine actually is, so operators either replace parts too early or find out too late.
An unplanned failure runs about $500,000. The same intervention, scheduled ahead of time, is about $35,000, so every failure caught early saves roughly $465,000, about 13 times the cost of the planned work. On a fleet of 50 engines avoiding two failures a month, that is $11.2M a year.
A stacked LSTM with attention.
The network reads a rolling 30-cycle window of 17 sensor features and learns which moments in that window actually matter. Attention is what lets it weight the timesteps where degradation shows up, instead of treating the whole window equally.
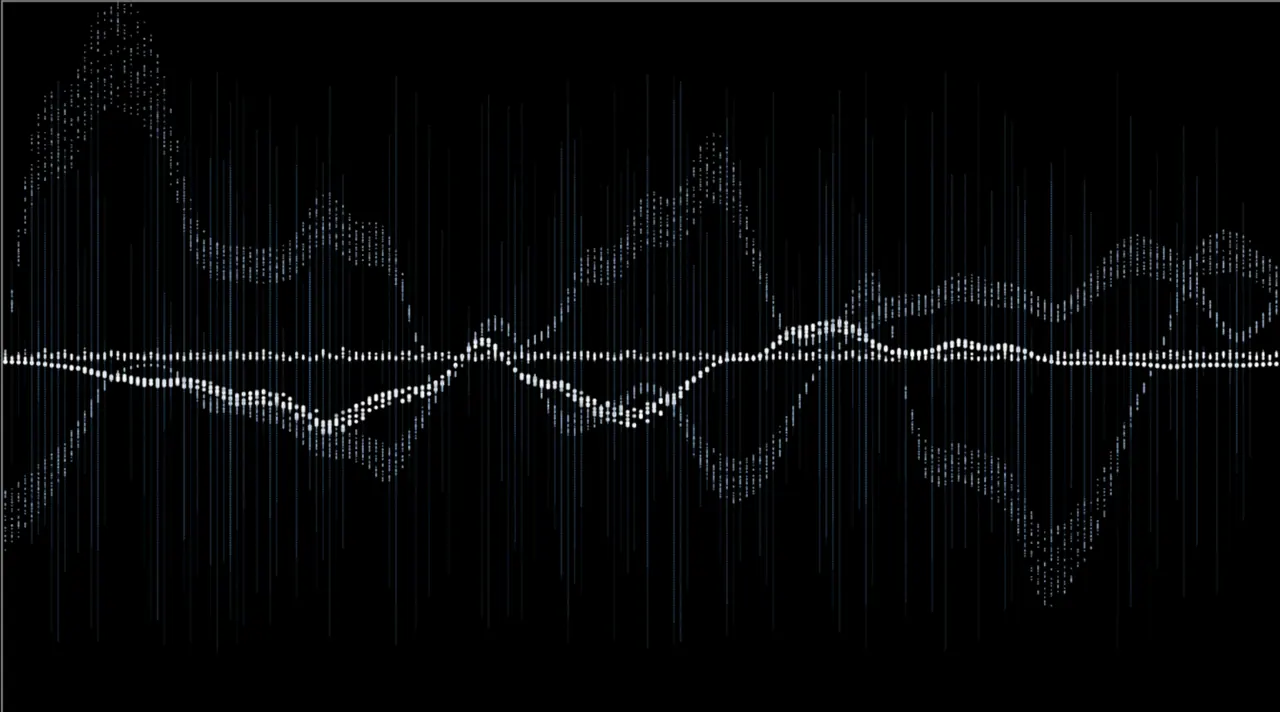
Below, the per-channel drift panel from the live app: six of the seventeen channels, each on its own scale. The readings, the ranges and the deltas are the app's own; only the traces move here, as a simulation inside each channel's real range, the same way the app animates them.
Four architectures, and the one we shipped.
All four were trained and compared on FD001, 100 engines and 17,731 sequences. GRU reached the lowest error. We deployed the LSTM with attention anyway, because it can show which timesteps and which sensors drove each prediction, and an estimate a maintenance engineer can interrogate is worth more than one cycle of RMSE. Published work on this dataset sits between 12 and 18 cycles RMSE.
Errors are in flight cycles, so the deployed model is on average about ten cycles out. 59% of its predictions land within ±10 cycles and 92% within ±25.
| Architecture | RMSE | MAE |
|---|---|---|
| SimpleRNN | 15.90 | 11.22 |
| LSTM | 13.71 | 10.26 |
| GRU lowest error | 13.57 | 9.97 |
| LSTM + attention deployed | 14.52 | 10.33 |
How it is trained
- Sliding windows of 30 cycles per engine.
- MinMax scaling across the 17 features.
- RUL capped at 125, so the model does not chase noise on healthy engines.
- Up to 100 epochs, early stopping, dropout after each LSTM layer.
How it is scored
- RMSE, the standard error, in flight cycles.
- MAE, the average miss.
- NASA score, asymmetric on purpose.
- It punishes late predictions far harder than early ones, because being optimiztic about a failing engine is the dangerous mistake.
Which sensors drive the call.
The dashboard surfaces the sensors contributing most to each prediction, so an engineer can see the physical story behind the number rather than a bare countdown.
Beside this: the model's top drivers for a single prediction on an engine 12 cycles from failure, as presented in the final deck. They are attributions across all 17 features, so they sum toward 1 rather than running on a 0 to 1 scale, and bar length is each one relative to the largest. Core speed leads; the operational settings contribute little in this example.
Attention weights · 12 cycles remaining
A product, not a notebook.
The dataset is NASA CMAPSS, which simulates turbofan engines run to failure, so the data is literally the business case. We started on FD001 for the cleanest signal and extended to FD003, which adds fan degradation alongside the same compressor wear, then shipped the whole thing as a deployable MVP.
/predict endpoint.The final deck.
The presentation we delivered for the Deep Learning course, from the business case and the CMAPSS data through the LSTM architecture to the deployed product. Scroll it in place or open it full screen.

What I worked on.
Built with a team of seven for the Deep Learning course. The interesting problem was not just fitting the network, it was framing the target properly, capping RUL so the model learns real degradation, and scoring it in a way that treats a late prediction as the serious failure it is.