Sustainable Aviation Datathon
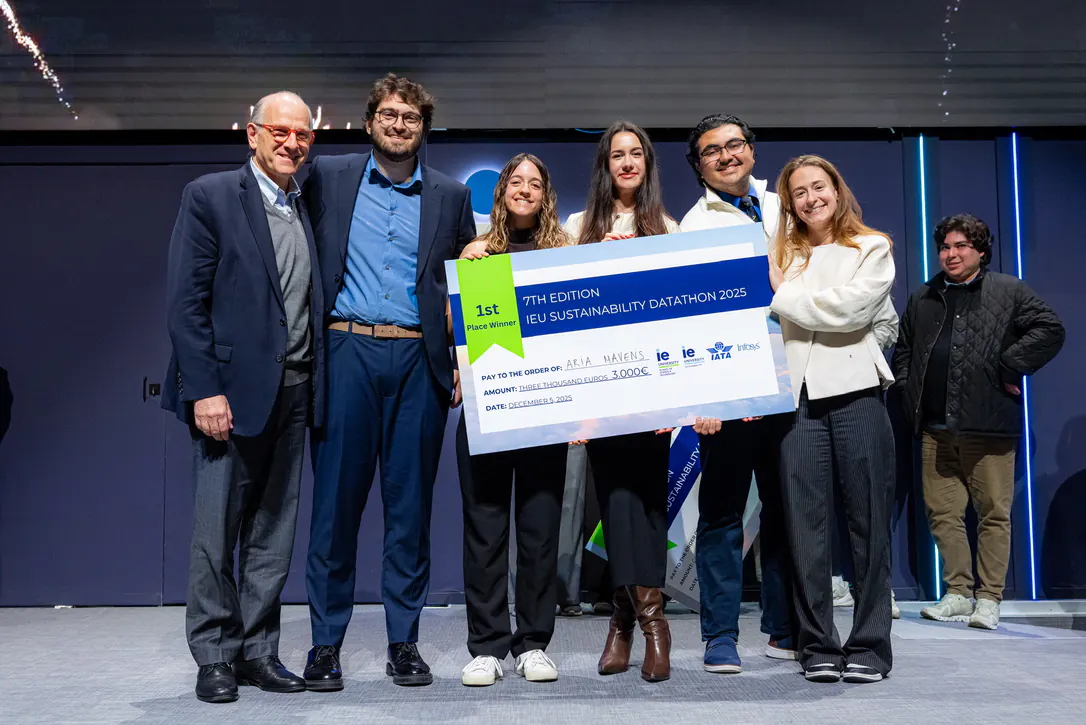
My team, Aria Mavens, won the December 2025 datathon. We forecast European aviation to 2050, modeled how sustainable aviation fuel bends the emissions curve, and priced what that path actually costs, told as one story the judges could follow end to end.
Can aviation grow and decarbonize?
The datathon asked us to make sense of aviation emissions and where they are heading. We worked with EUROCONTROL airport traffic data and CO₂ emissions history, forecast European flight demand to 2050 under three demand scenarios, and then asked the harder question: what does the sustainable path cost, and who pays for it.
Line chart of European flight volumes: actual history 2005 to 2023 including the 2020 collapse to 4.08 million, then high, base and low forecast scenarios reaching 13.8, 11.8 and 9.4 million flights by 2050.
SAF bends the curve.
Flights keep growing in every scenario, so efficiency alone cannot get aviation to its targets. Sustainable aviation fuel is the lever: as the blending share rises toward 70% of the fuel mix, the CO₂ avoided each year climbs to about 115 megatonnes by 2050.
Area chart of annual CO2 avoided through SAF adoption: 10.9 megatonnes by 2030, 58.3 by 2040, 115.4 by 2050.
Scatter plot of SAF blending share against CO2 avoided, rising from near zero at a 2% share in 2026 to about 115 megatonnes at a 70% share in 2050. The chart's own point labels mark the 2026 and 2050 ends directly.
What the path costs.
The recommendation only holds if the cost side holds, so we priced it. By 2050 the SAF premium is about €60M of a €123M total fuel bill, roughly 48%. We phased the deployment to see whether the trade gets worse as it scales, and it does not: every phase buys about 1.2 megatonnes of CO₂ avoided per million euros of premium.
Stacked area chart of total fuel expenditure 2026 to 2050, split into baseline fuel cost and SAF premium, reaching 123 million euros total with a 60 million euro premium by 2050.
| Deployment phase | CO₂ avoided | SAF premium | Mt per €M |
|---|---|---|---|
| Early2026–2035 | 96.2 Mt | €82.3M | 1.17 |
| Acceleration2036–2045 | 377.6 Mt | €319.5M | 1.18 |
| Maturity2046–2050 | 315.6 Mt | €266.0M | 1.19 |
The deck and the report.
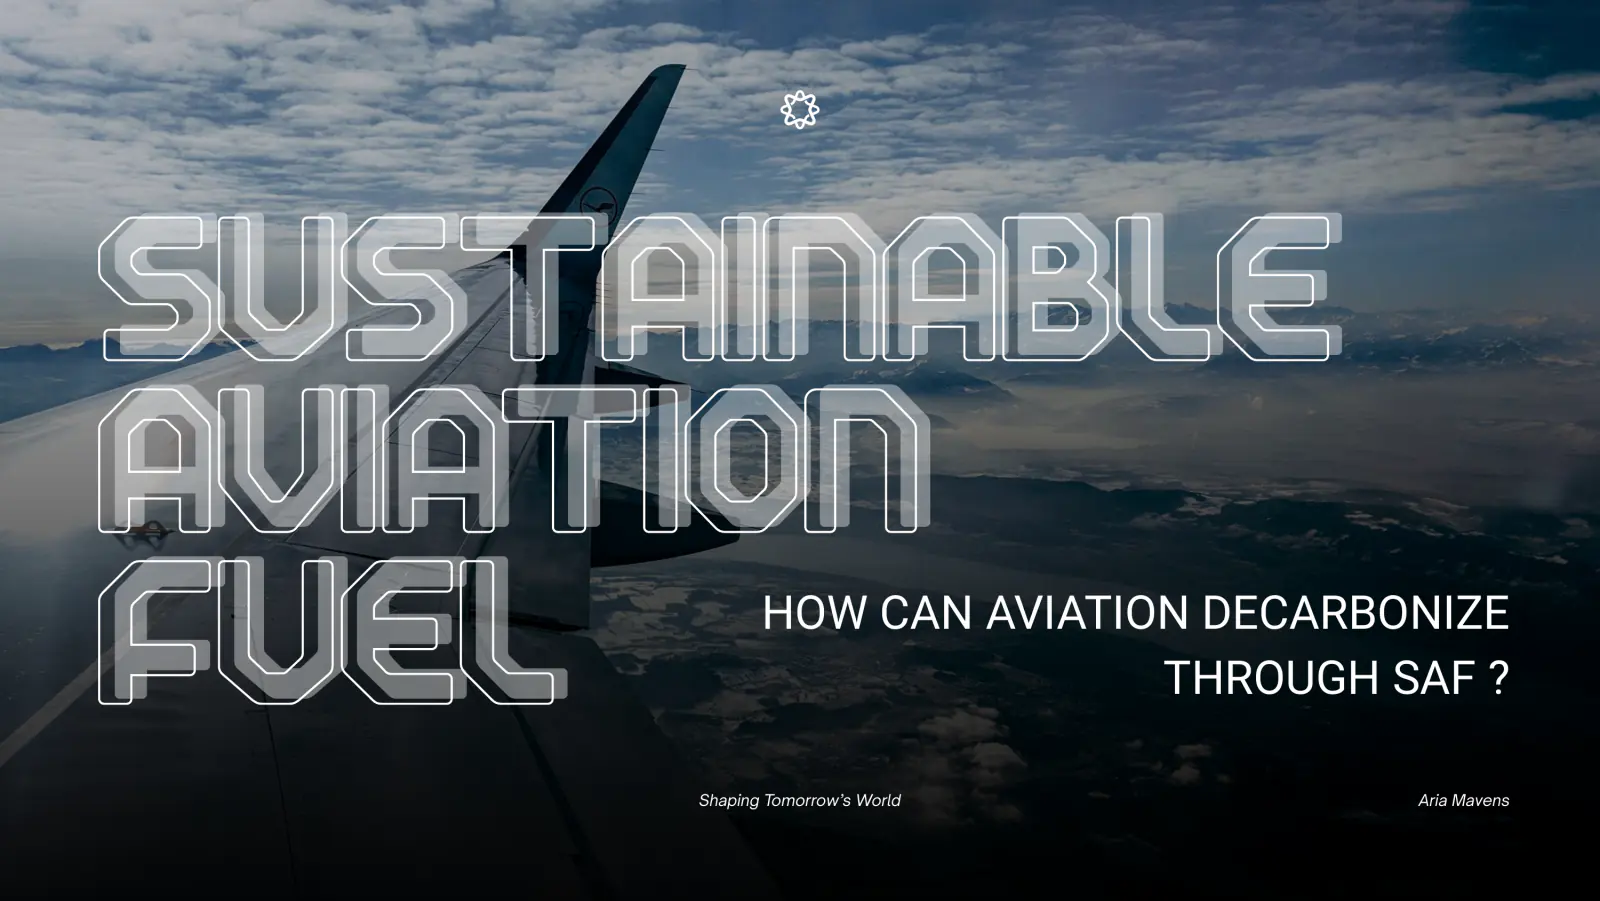
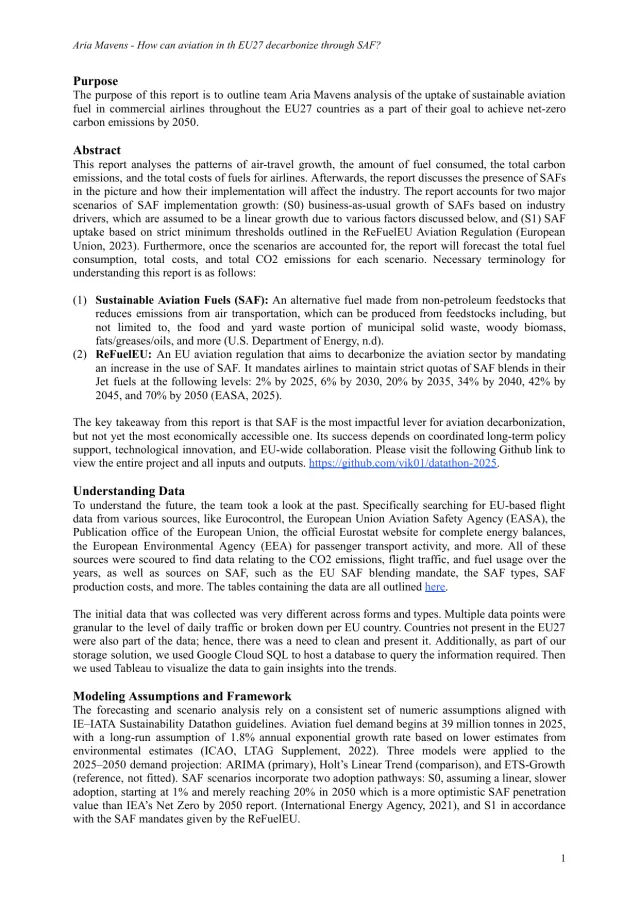
The presentation we gave the jury and the written report behind it, both scrollable in place.
A story the judges could follow.
We built the whole thing so the judges could follow it from the raw data to a clear recommendation without needing us to explain every chart. That clarity, backed by the forecasts and the cost analysis, is what put us in first place.